Charts
The top section of a well document shows the decline curves for all products and segments.

You can customize the following chart settings directly on the chart:
- X-Axis: choose Linear or Logarithmic. This option is only available in the Rate vs Producing Time and Rate vs Cumulative views (see Chart Type).
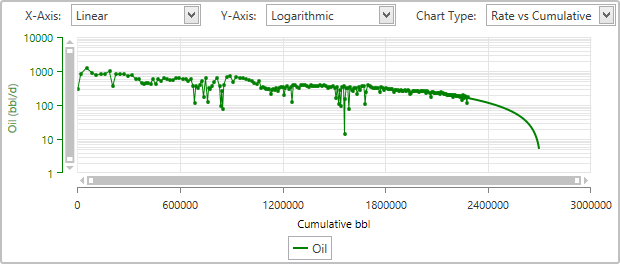
- Y-Axis: choose Linear or Logarithmic. The image above shows the Logarithmic option.
- Chart Type: choose from Rate vs Time, Rate vs Producing Time, Rate vs Cumulative, Duong q/Q vs Time or Duong t(a,m) vs Time (thes are described in the table below). The image above shows the Rate vs Cumulative option.
| Setting | Description |
|---|---|
| Rate vs Time | A chart type showing the calendar day production rates with date-based timescale. Calendar rates are calculated by dividing the vol in a period by the total number of hours in that period. This chart accurately represents the production in real time and dates and is appropriate for use with economic models. |
| Rate vs Producing Time | A chart type showing production rates that are adjusted using imported producing hours with a generalized timescale in days. Producing time rates are calculated by dividing the volume in a period by the number of hours in the period in which the well was active. This chart is representative of the idealistic view of well production where there are no interruptions. Curves fit on the producing time scale better represents the petrophysics of the geology. |
| Rate vs Cumulative | A chart type that is commonly used on the semi-log scale to highlight the linearized behaviour of the exponential decline curve. This chart is most commonly used to forecast the EUR of a well graphically by estimating where the production rate crosses the x-axis. |
| Duong q/Q vs Time | A plot of q vs t(a,m), used to determine the q1 value as part of the Duong methodology where t(a,m)=t^(-m) e^(a/(1-m)(t^(1-m)-1)) Note that this chart type is only compatible with Duong curves. |
| Duong t(a,m) vs Time | A plot used to determine a and m values as part of the Duong methodology (a is the intercept and –m is the slope). Note that this setting is only compatible with Duong curves. |
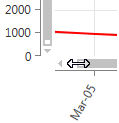
To zoom in and out of the chart, click and drag the white squares at the ends of scrollbars, as shown below. To move along a zoomed chart, click the arrows at the ends of scrollbars or click and drag the scrollbars themselves.

